One connected model
Companies, products, people, investors, funding rounds and market events are resolved into a shared graph rather than isolated lists.
A weekly brief on what changed in your market, every finding linked to its source. OmniaGraph follows the companies, assets and regulators you name and tells your team what moved, with a score for how well the evidence holds up.
Investment teams
Corporate strategy
Market intelligence
Research platforms
From the registers to the brief in your inbox, then into the tools your team already uses. Under a minute, using invented examples.
Screens from the OmniaGraph app, showing a monitor for an invented logistics portfolio.
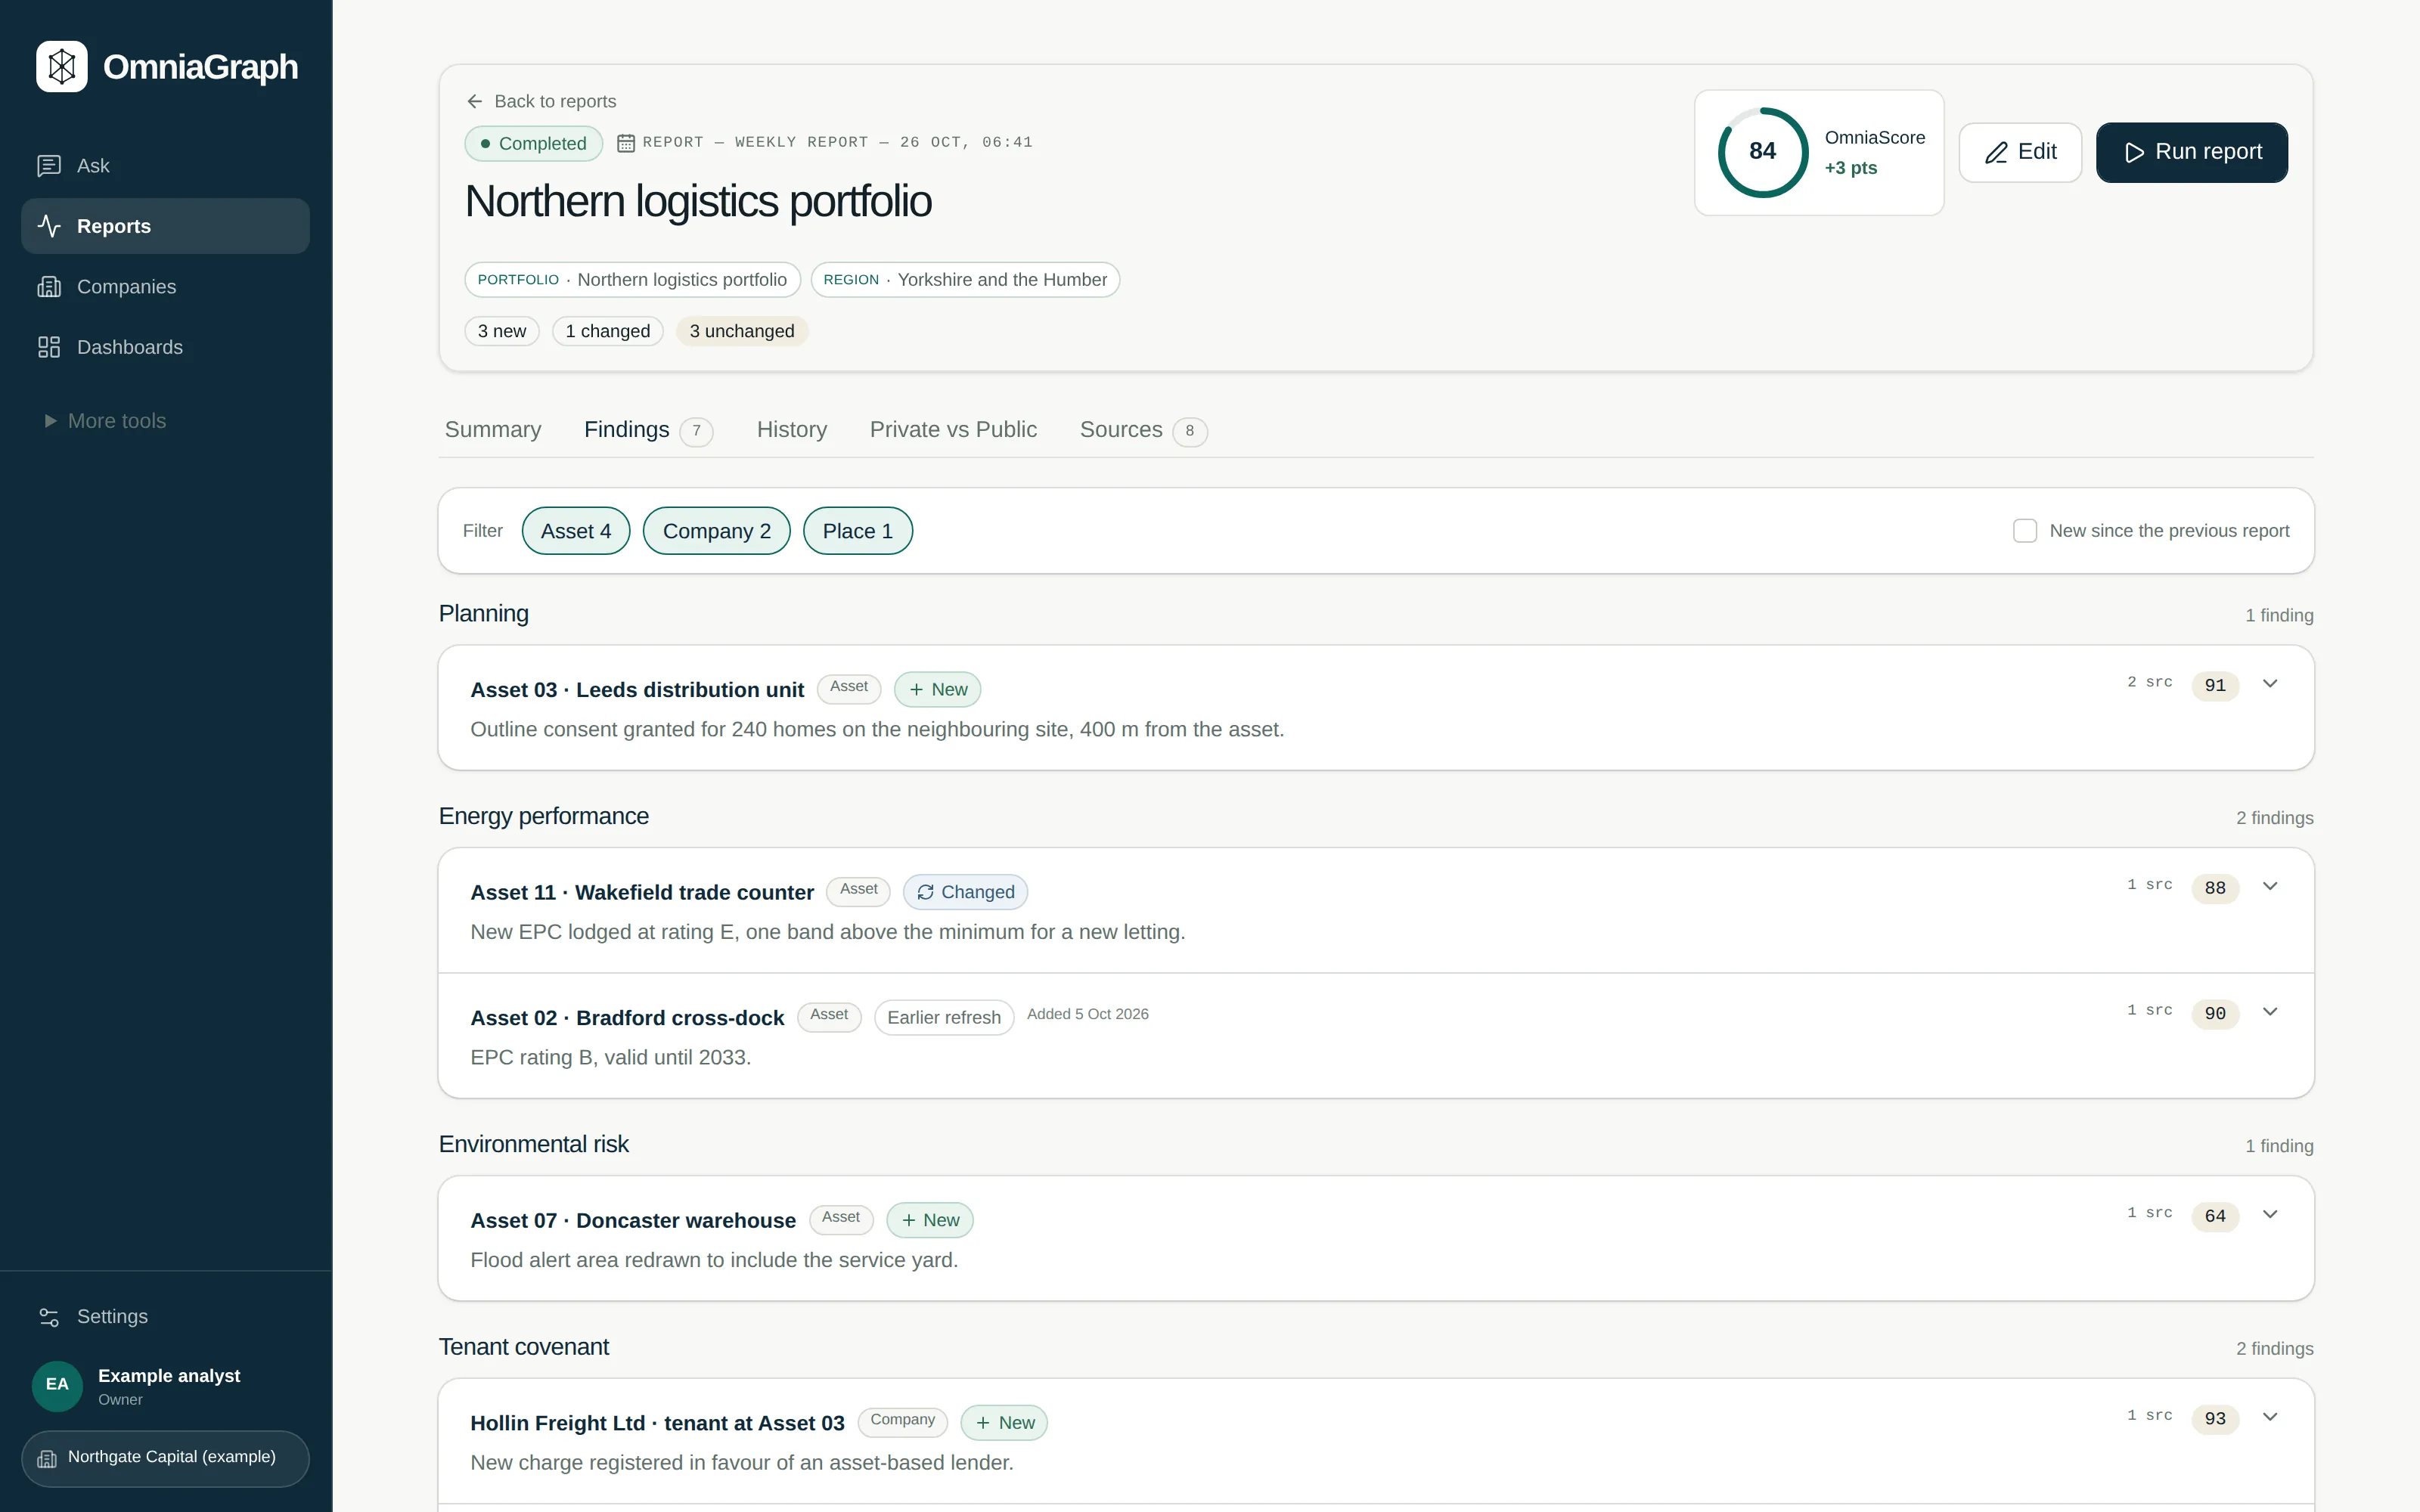
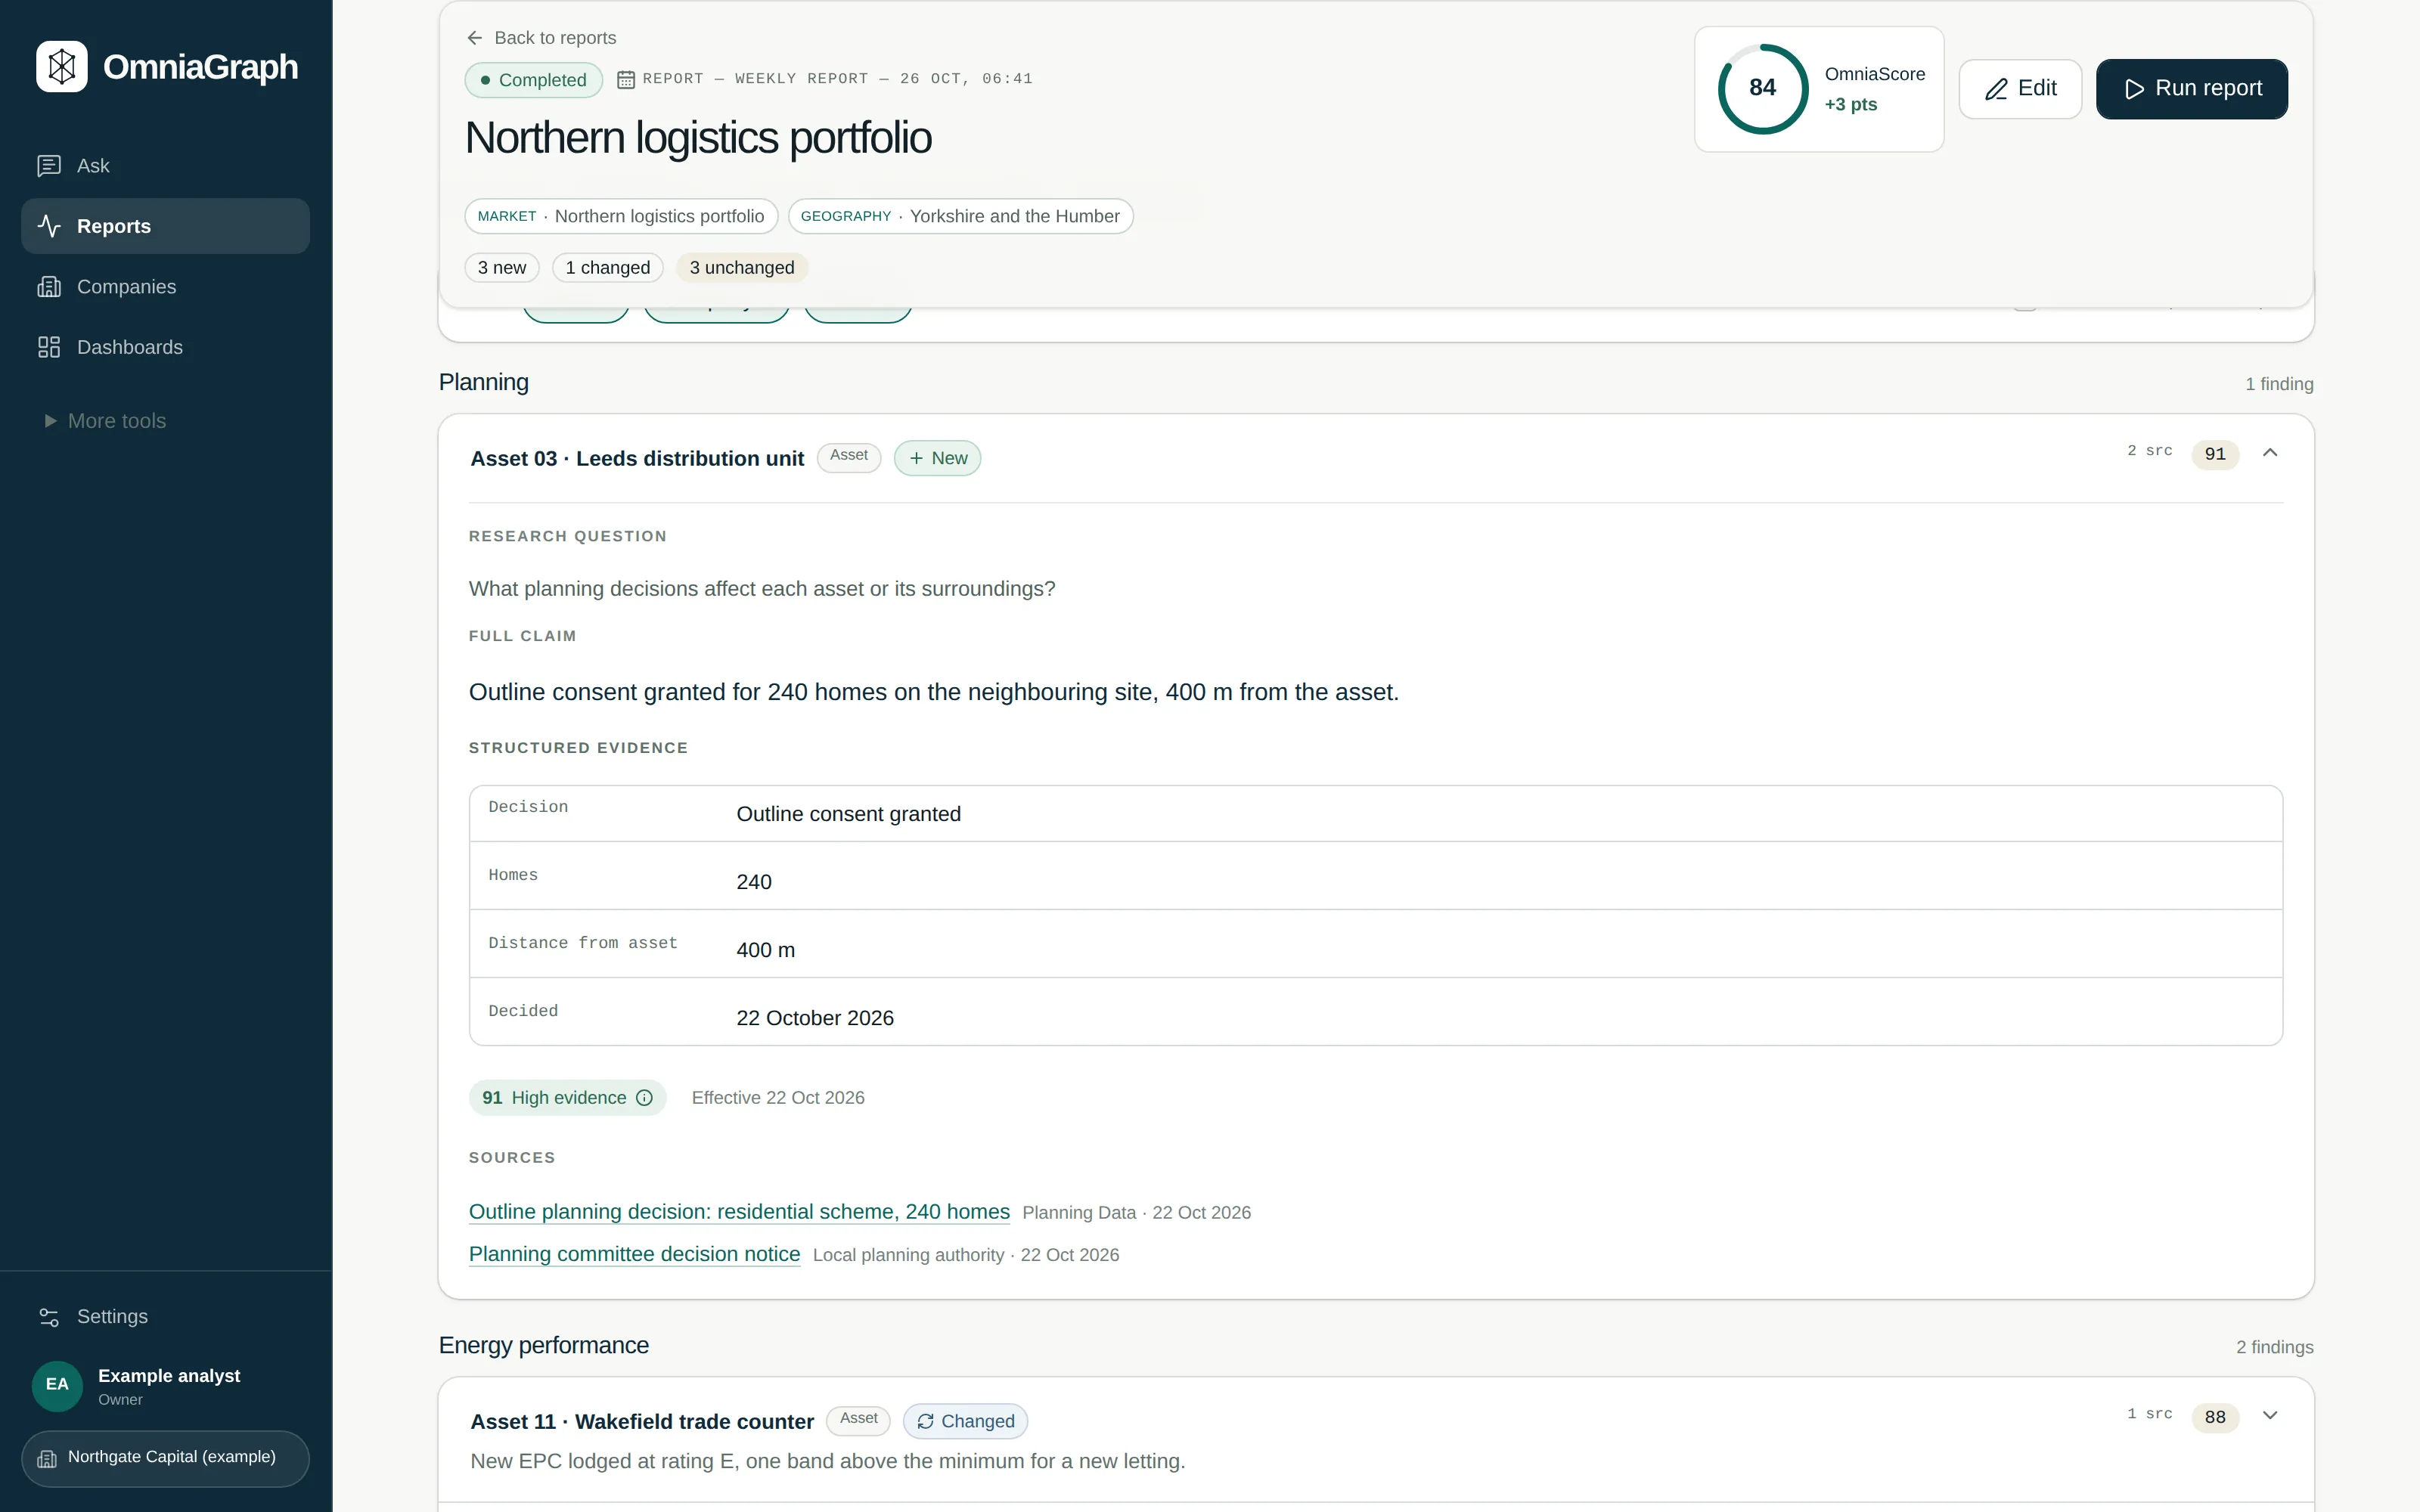
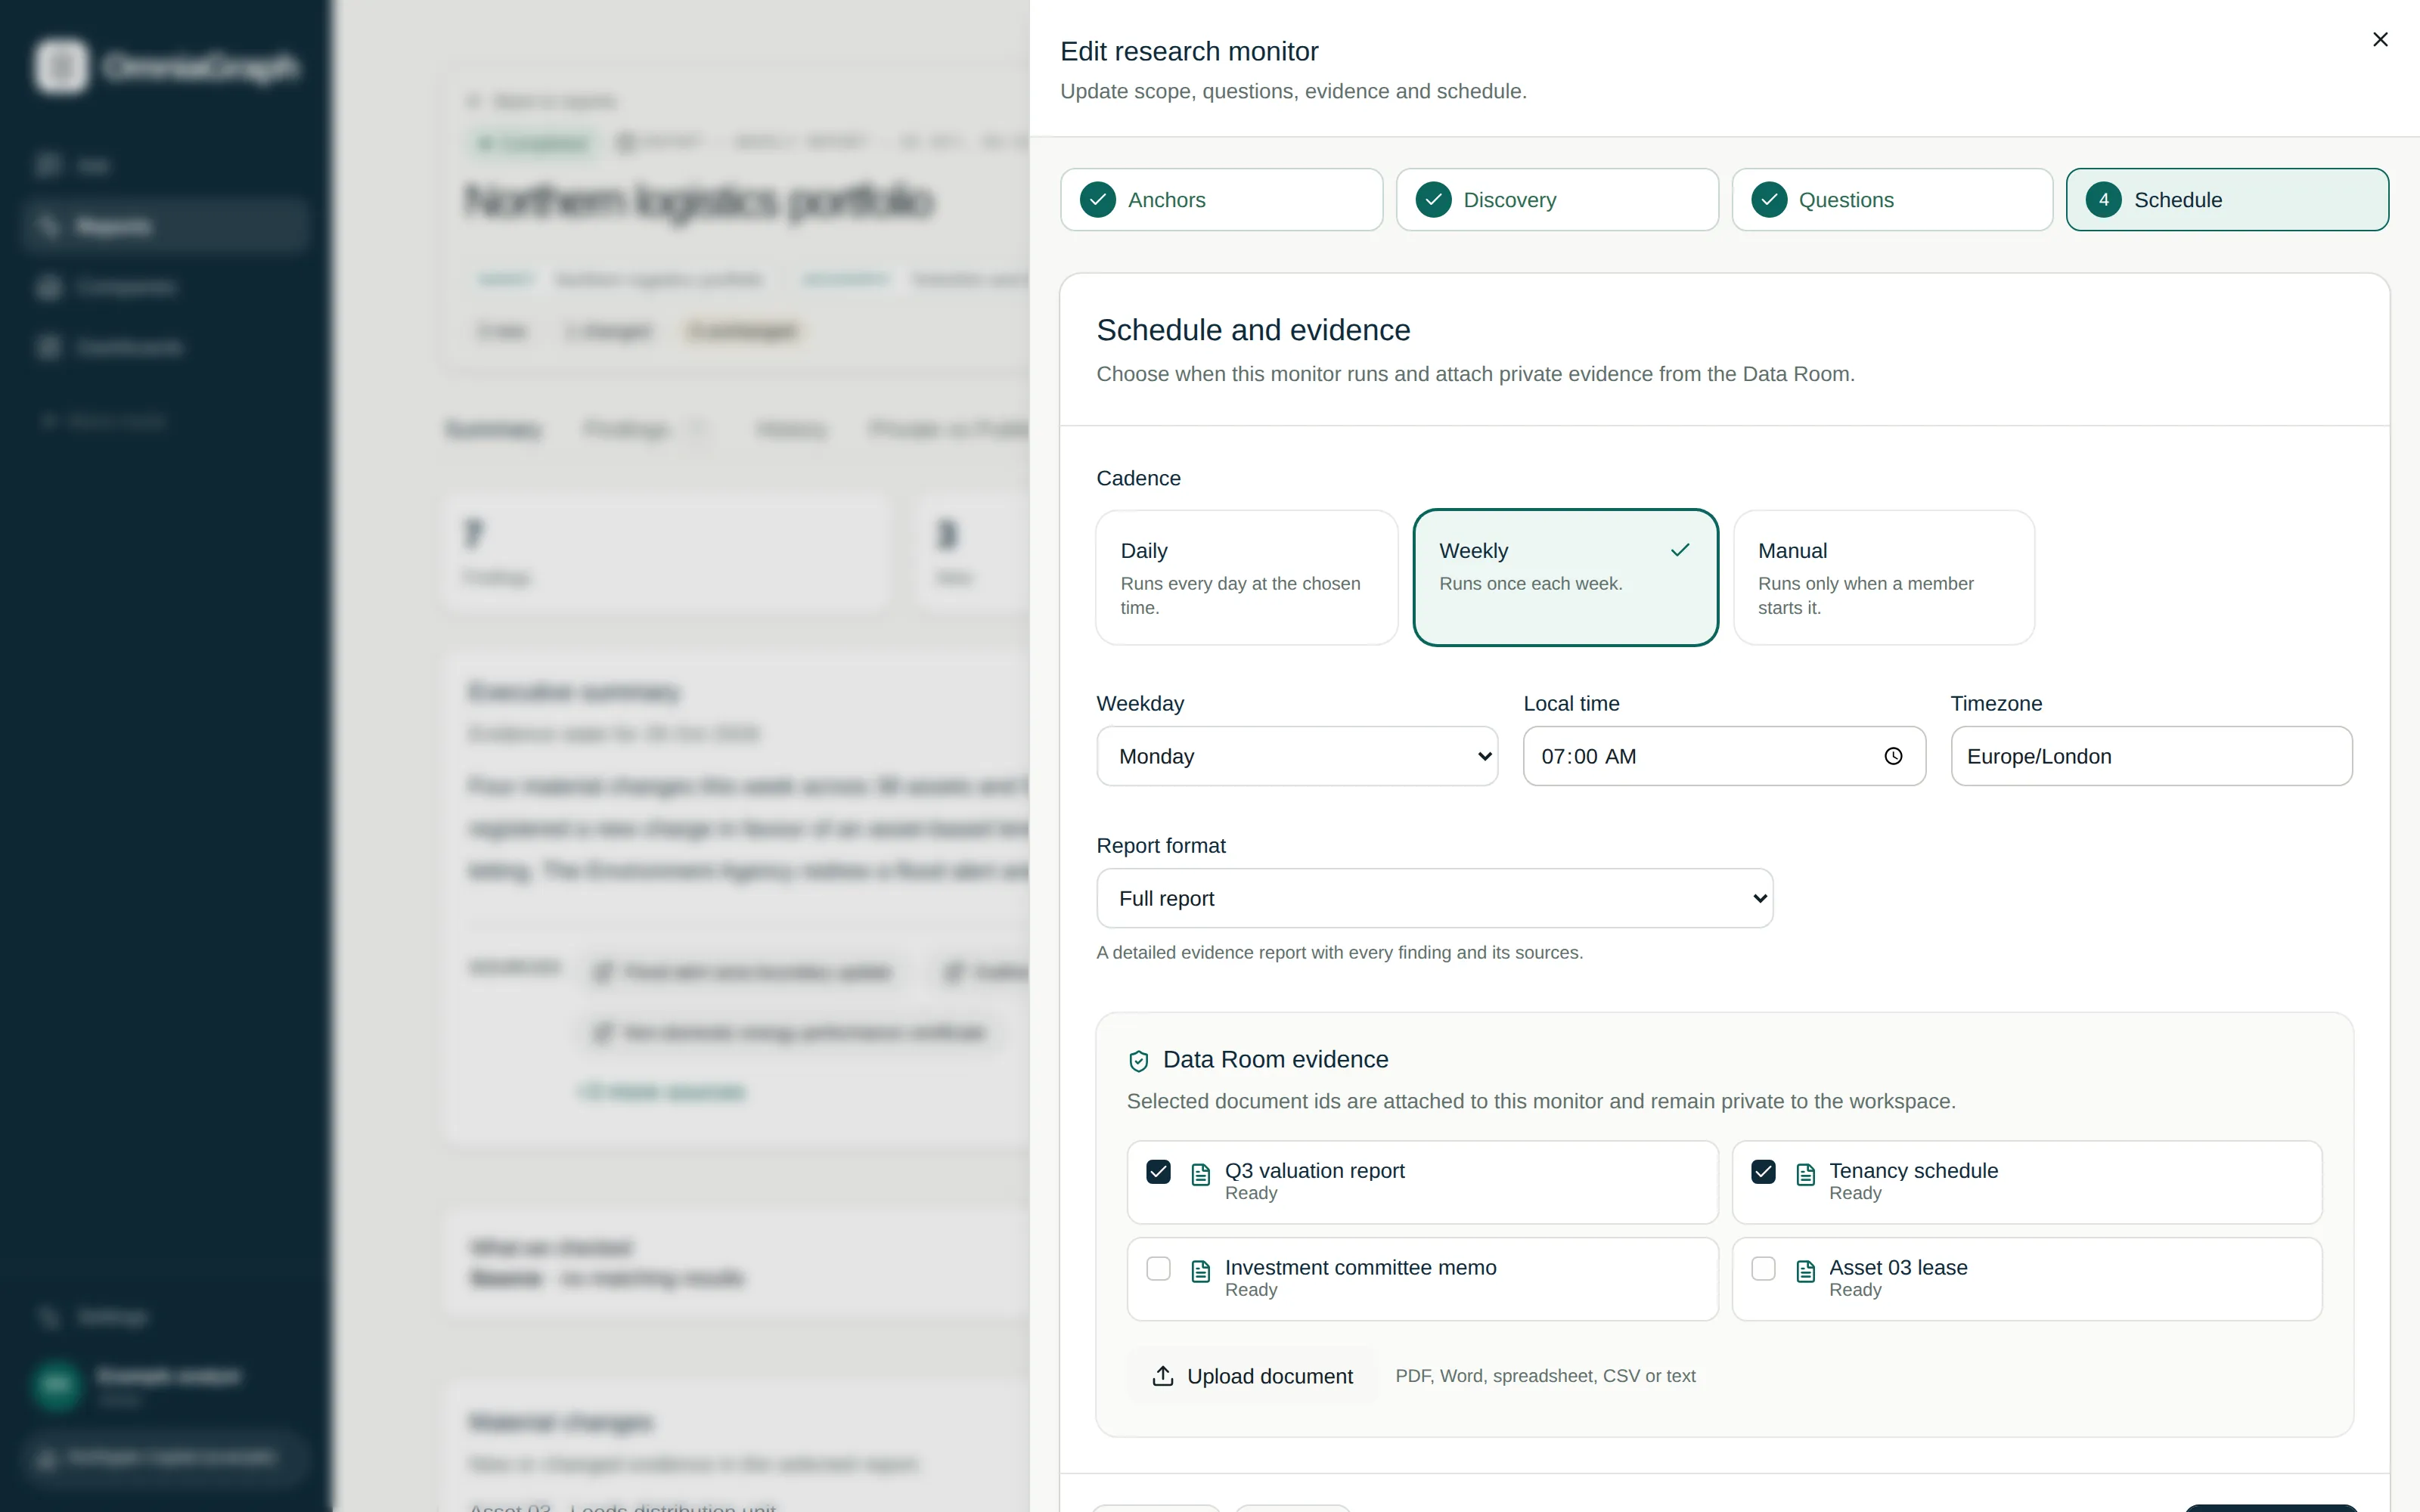
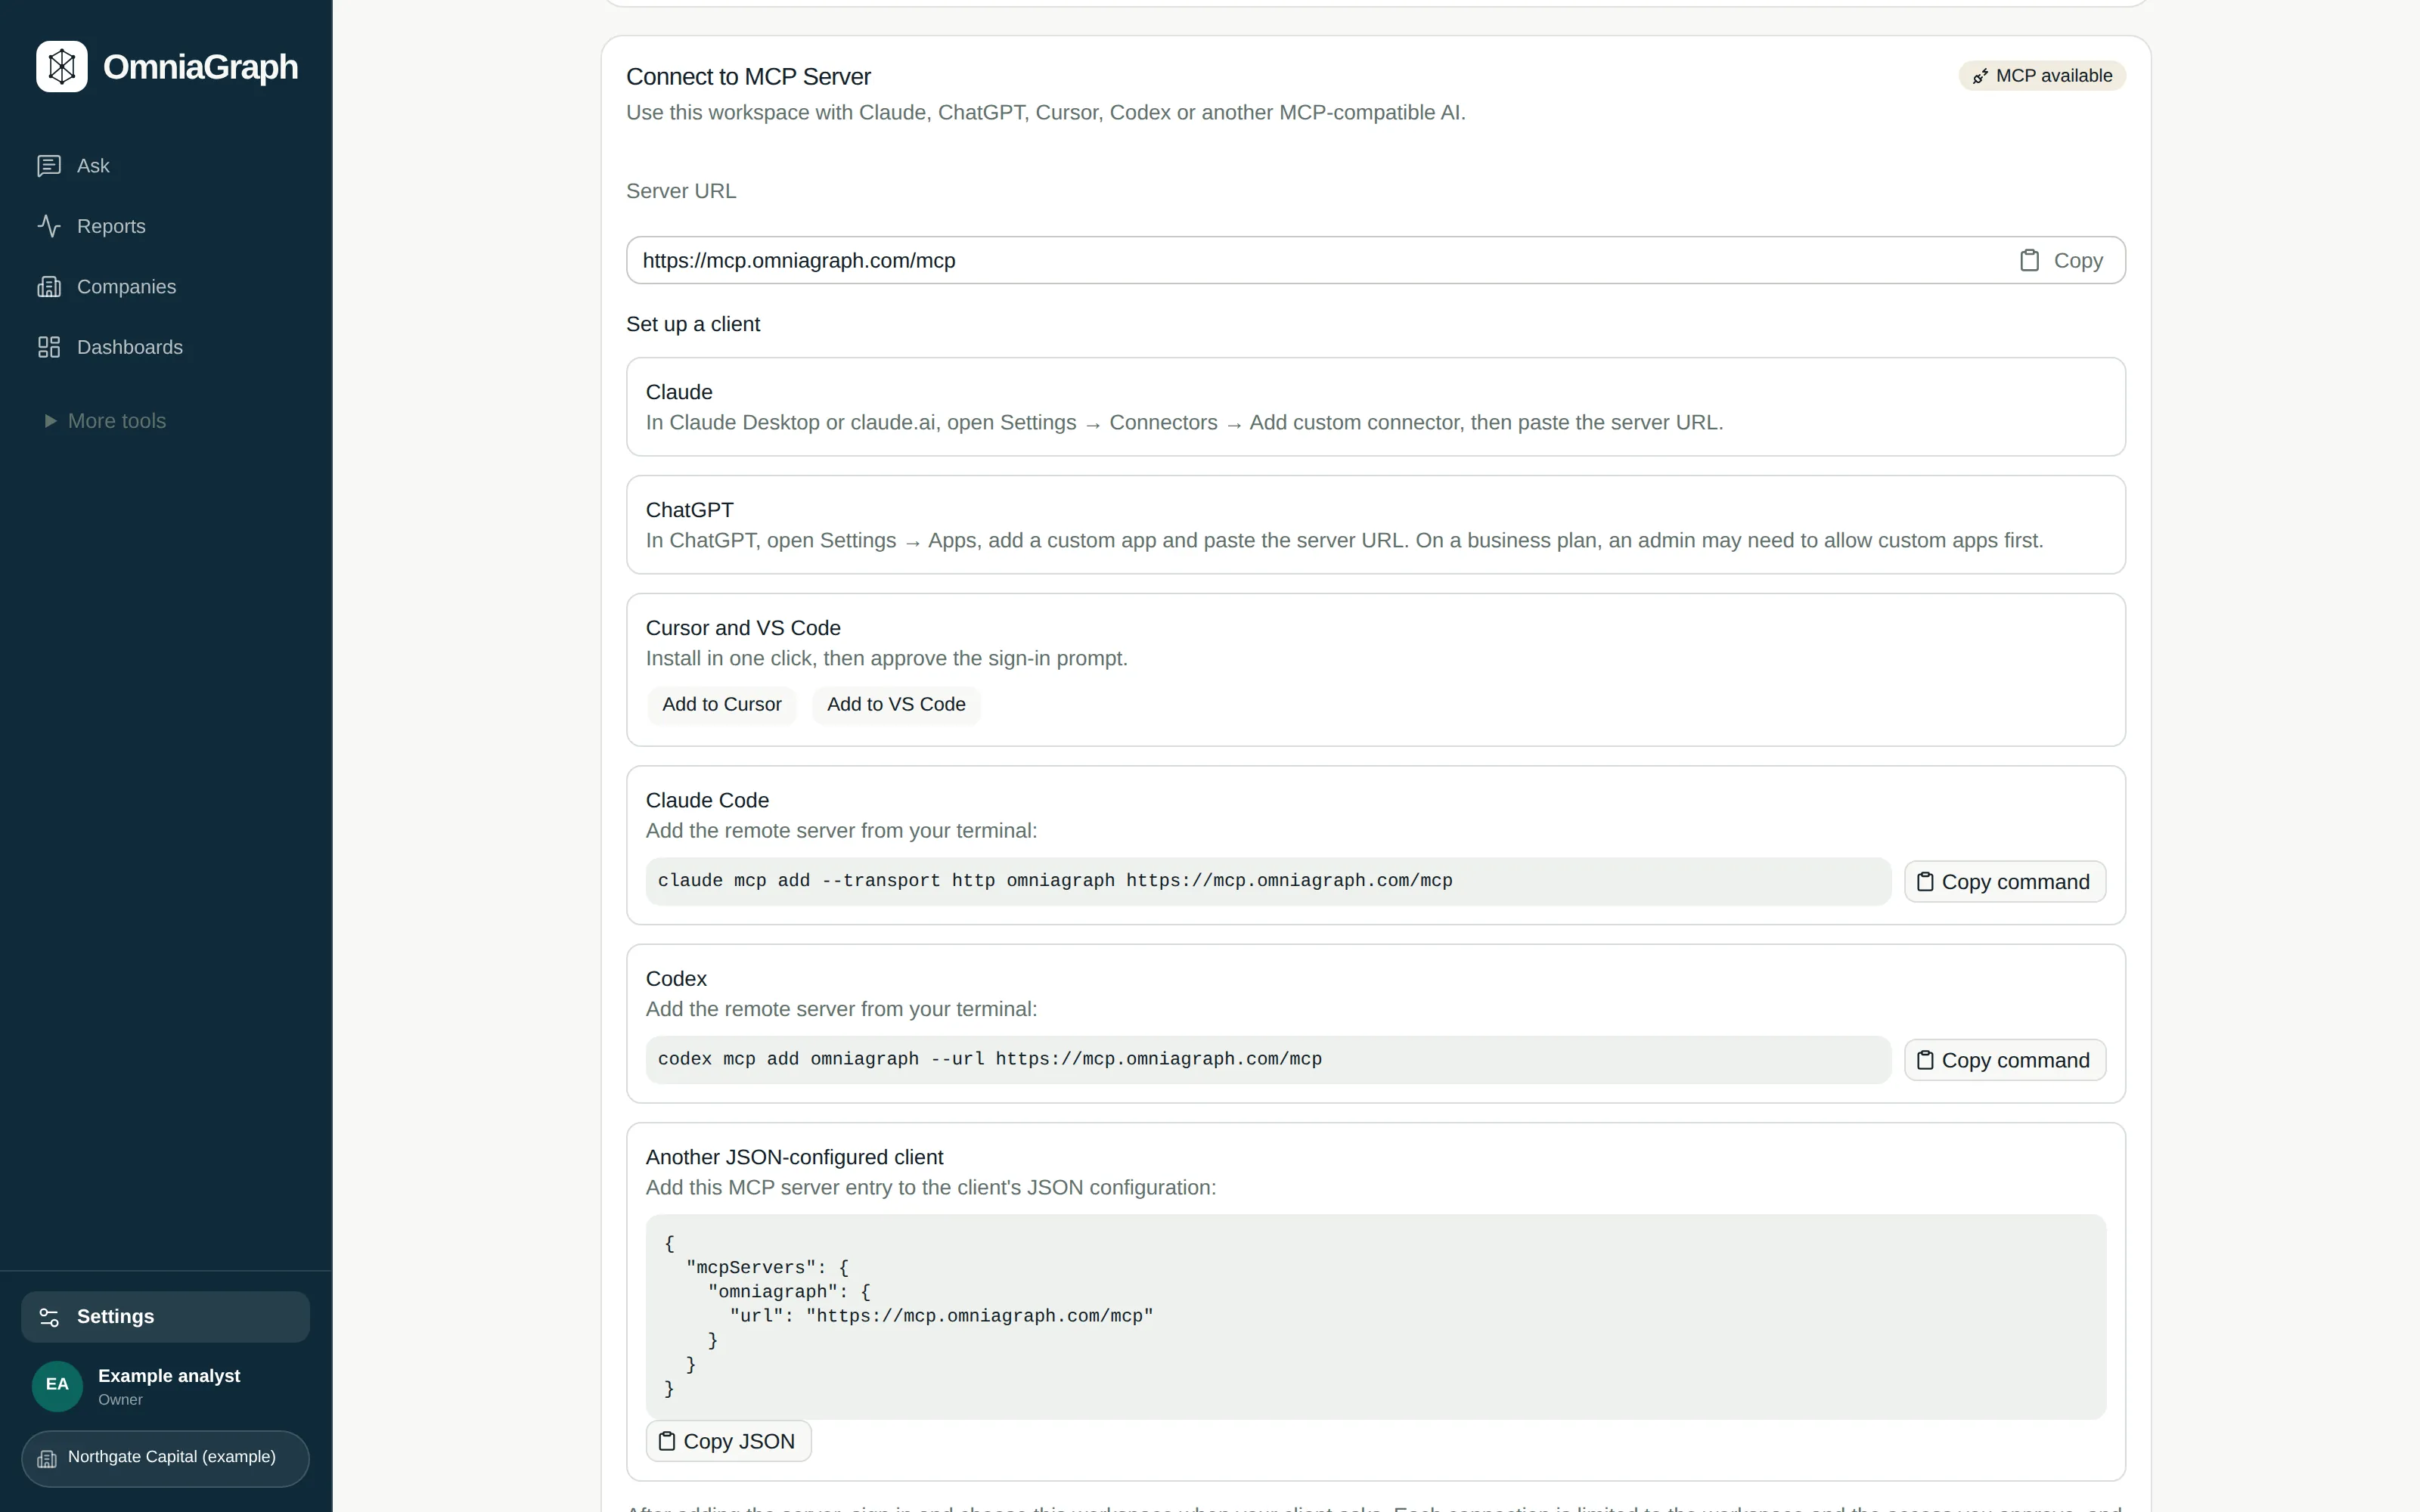
Conventional databases are constrained by fixed taxonomies and periodic research cycles. OmniaGraph is designed around the way specialist markets actually evolve: continuously, unevenly and across thousands of sources.
Companies, products, people, investors, funding rounds and market events are resolved into a shared graph rather than isolated lists.
Values can retain their source, verification date and confidence, making the path from published evidence to usable data clear.
Specialist research agents monitor relevant sources, detect meaningful changes and update the graph without waiting for the next manual research cycle.
New evidence does not create another disconnected document. It strengthens the market graph, updates the relevant record and remains available for review.
Market data is only useful when you can understand where it came from and when it was last checked. OmniaGraph keeps provenance close to the data, enabling analysts to review important claims instead of accepting an unexplained answer.
A deterministic indicator from 0 to 100 showing how strongly the available evidence supports a finding. It is calculated from explicit inputs, not generated by an LLM. It tells you how solid the evidence is; it does not rate a company or recommend an investment.
Evidence strength, not a guarantee of truth. The same evidence always produces the same score, and every score can be traced back to the sources behind it.
OmniaGraph already underpins a specialist research product in humanoid robotics, connecting company, robot, funding, people and news data across a rapidly changing global market.
Use a consistent intelligence layer across market discovery, company research, pipeline development and ongoing monitoring.
Identify relevant companies, products, investors and relationships in unfamiliar sectors.
Bring operating signals, leadership, funding and momentum into one research workflow.
Track the events and field-level changes that matter after the first piece of research is complete.
Move structured records into CRM, analytics and proprietary research products.
Start with a defined research problem, then expand into continuous monitoring and deeper integration as the intelligence layer proves its value.
A sourced view of the companies, people, products and capital shaping one market.
Watchlists, verified change feeds and alerts that keep priority markets current.
Custom schemas, analyst review and delivery into internal data and research workflows.
Each industry adds its own entities, language and research questions while retaining a common foundation for companies, people, capital and evidence.
Briefs arrive by email and as PDF. Findings export as CSV or JSON, signed webhooks announce material changes, and an MCP connection lets your team's AI assistant query the workspace directly.